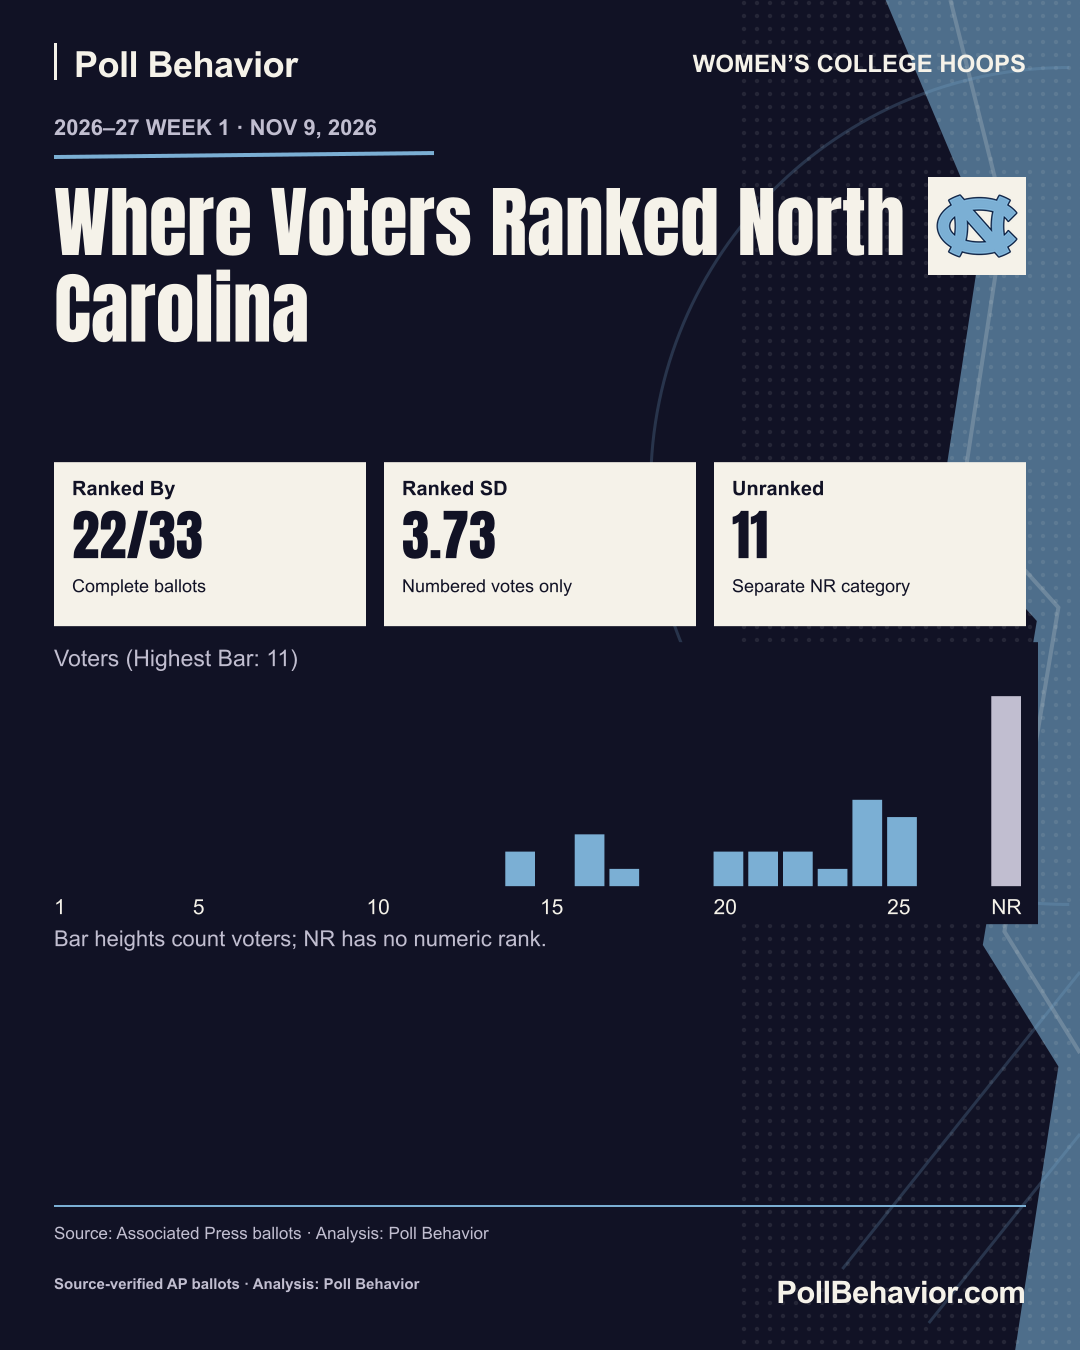
Biggest Disagreement

#14–#25
3.73 SD · 11 Unranked Votes
Explore the Votes →The votes, teams, and results that stand out this week.
Source: Associated Press · Published Basketball Ballots. Calculations use the recovered complete named ballots available for this edition.
2026–27 Week 1 · A quick look at this week’s standout votes and moves.
3.73 SD · 11 Unranked Votes
Explore the Votes →AP Rank · Previous → Current
See Poll Changes →Voters Ranking or Leaving Out
See the Split →Highly ranked teams left off ballots, and teams nearly everyone included.
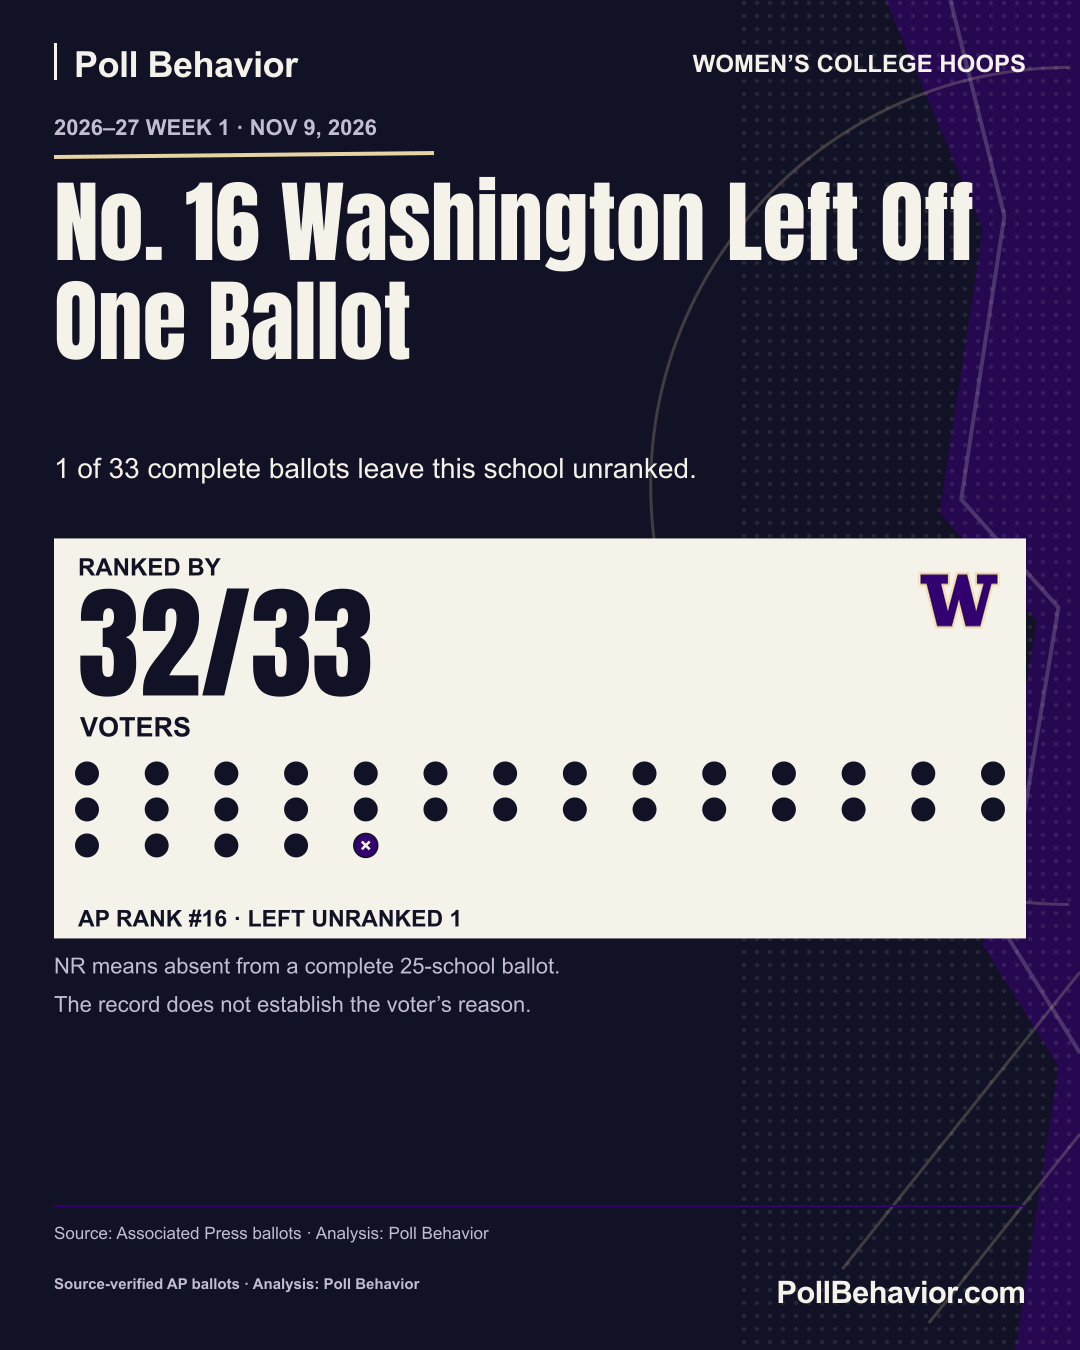
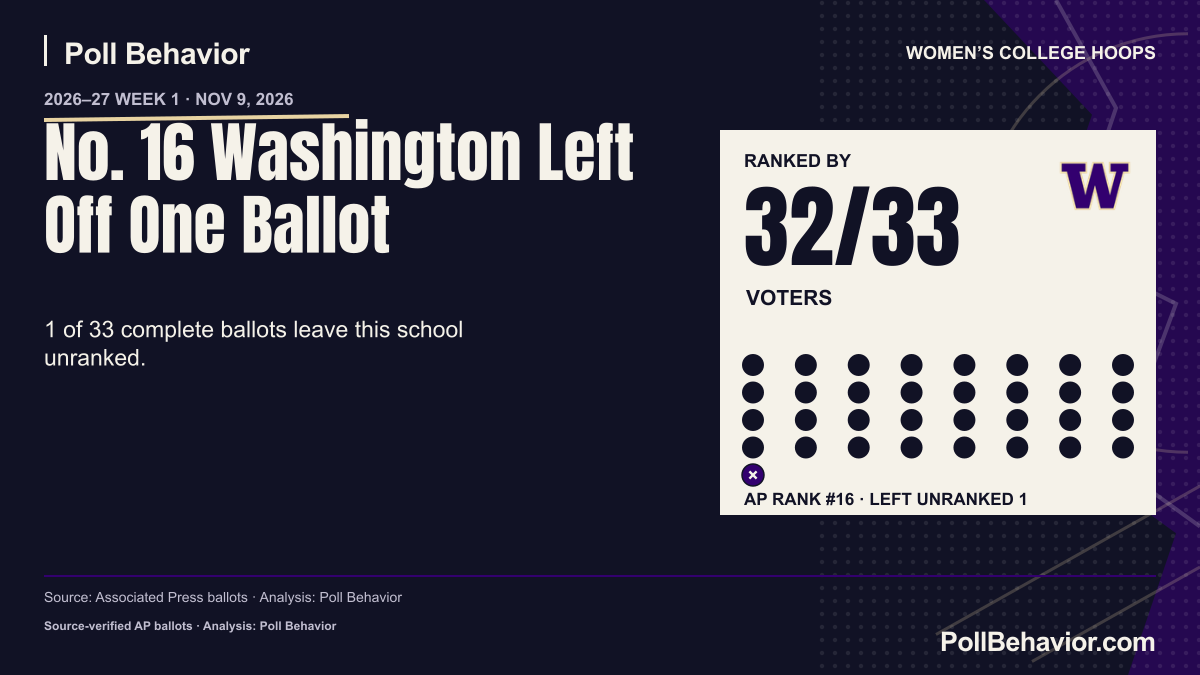
32 of 33 voters ranked Washington. Maggie Vanoni was the only voter to leave the team out.
Download This Graphic
No. 16 Washington Left Off One Ballot
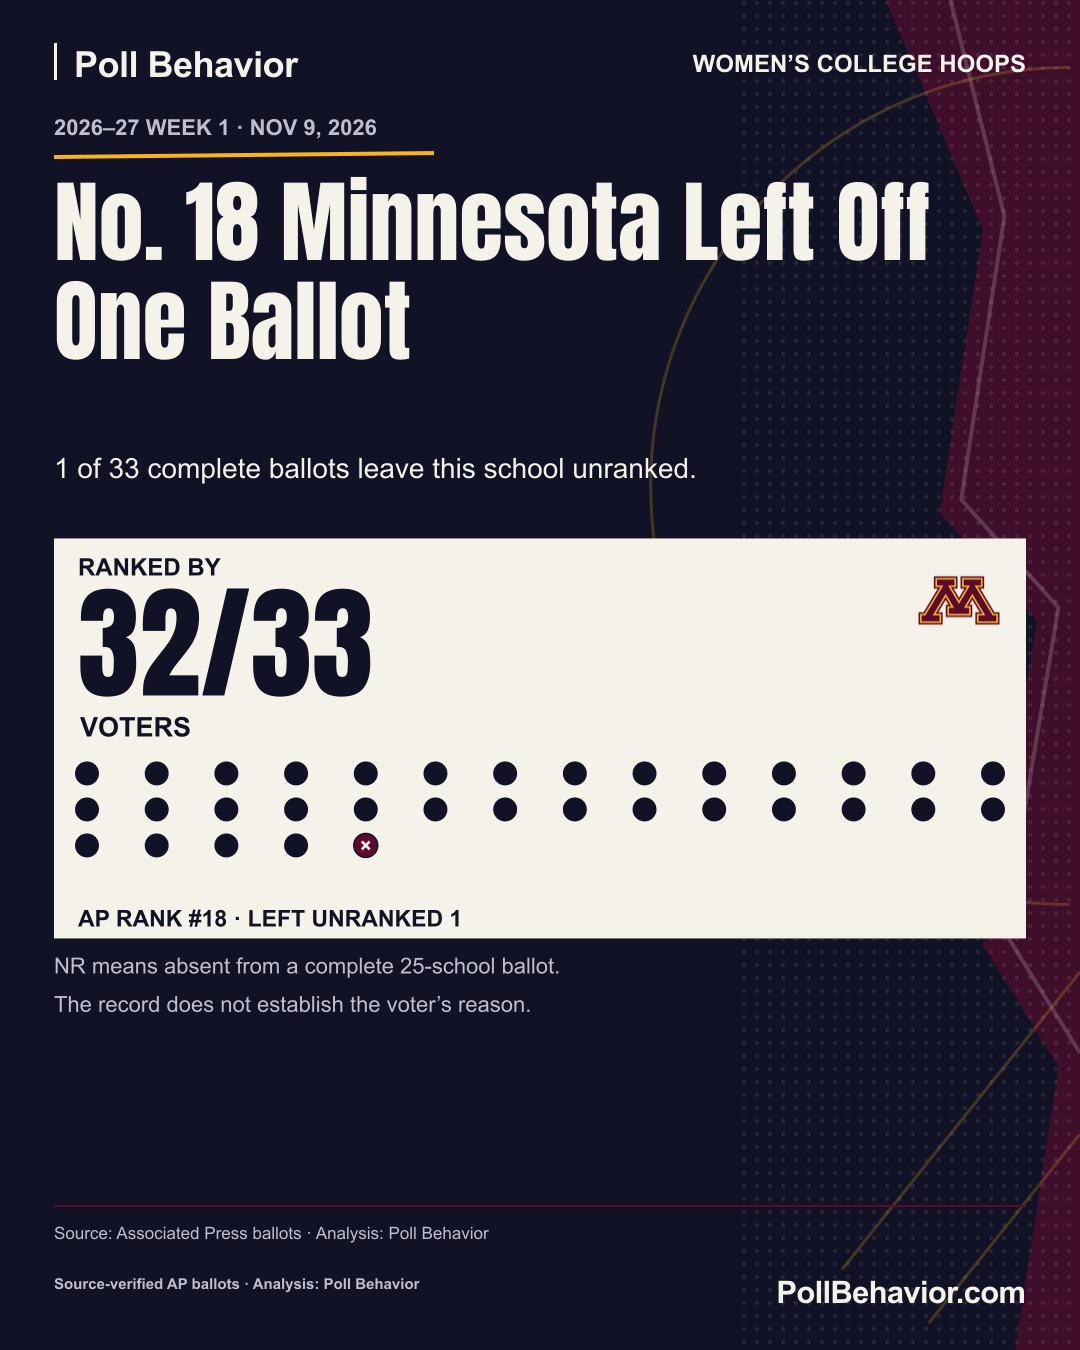
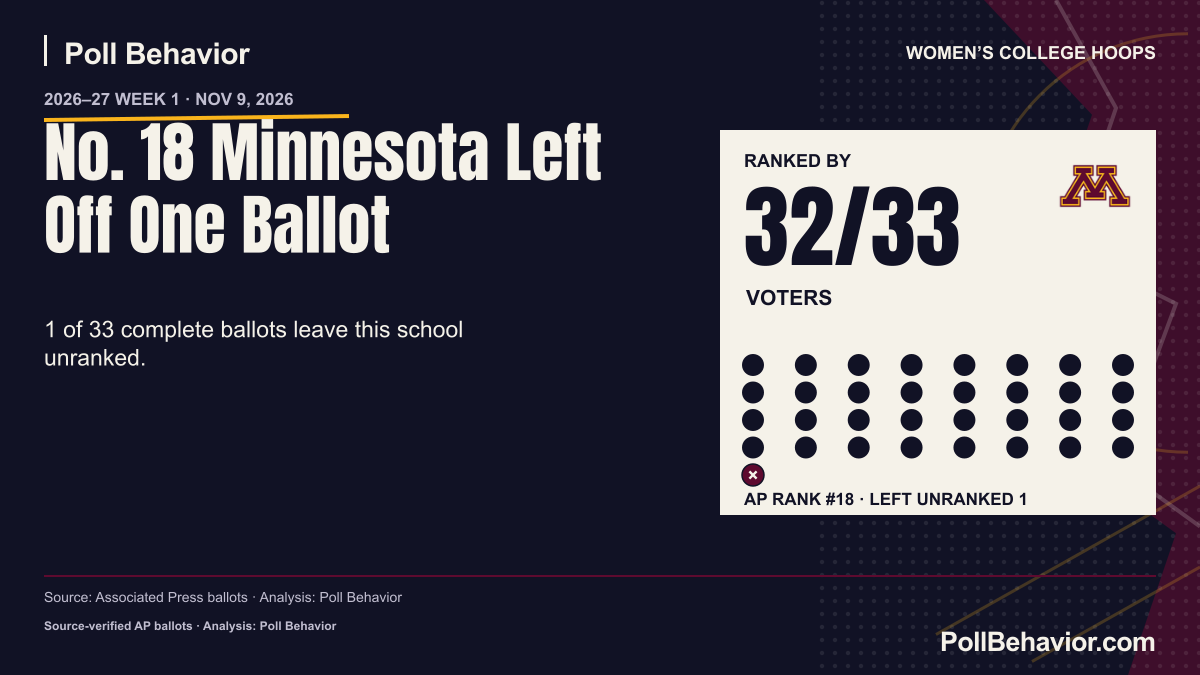
32 of 33 voters ranked Minnesota. Murray Evans was the only voter to leave the team out.
Download This Graphic
No. 18 Minnesota Left Off One Ballot
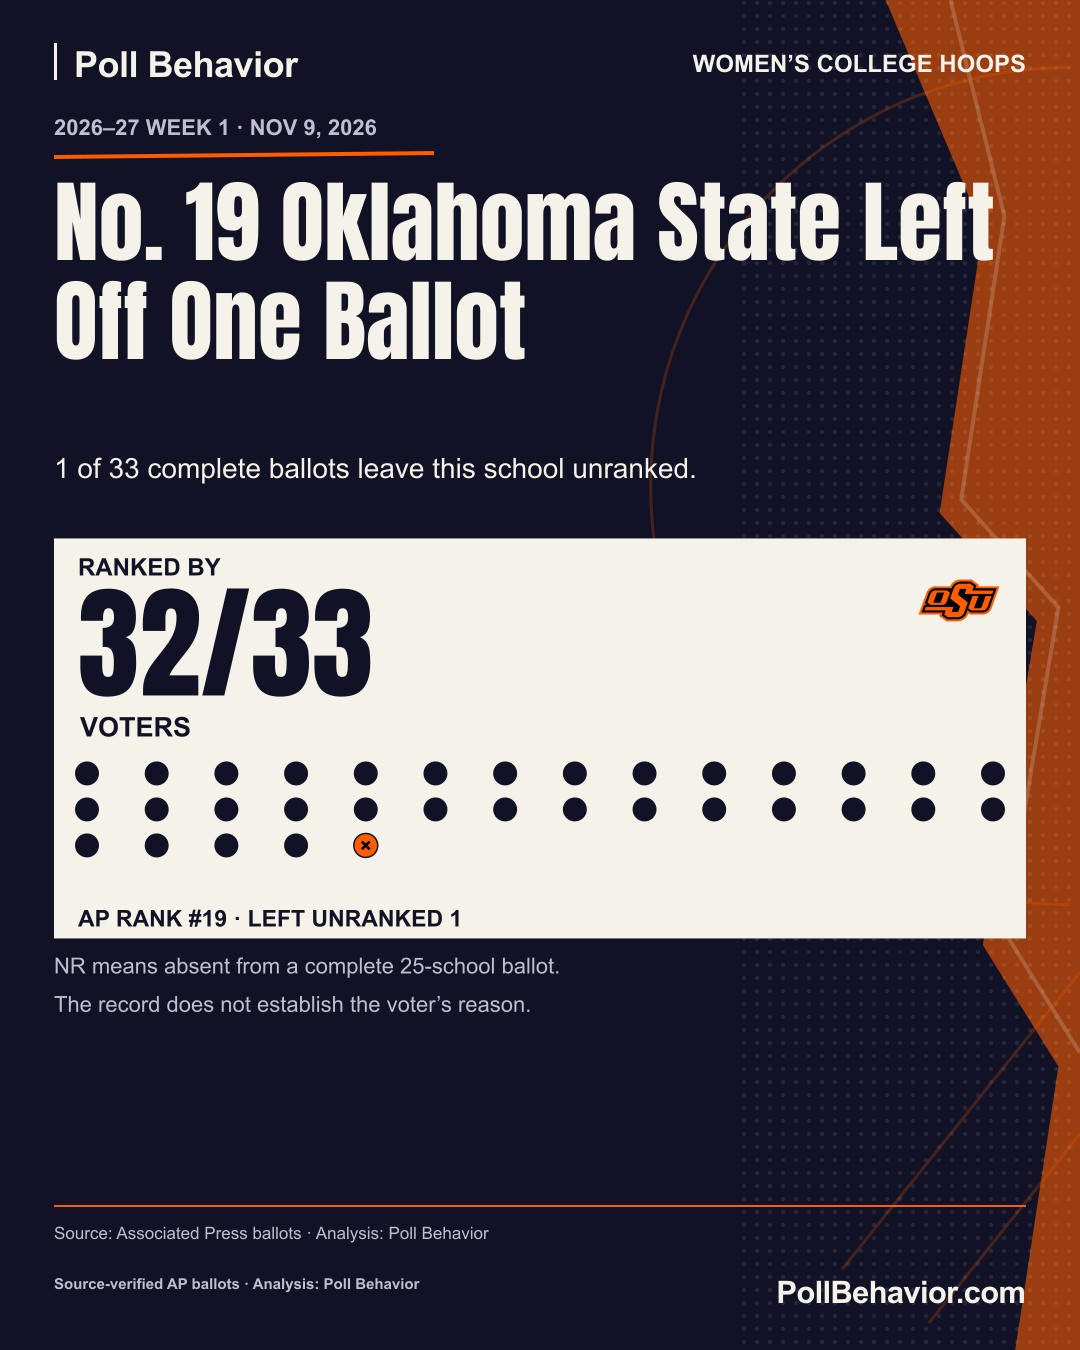
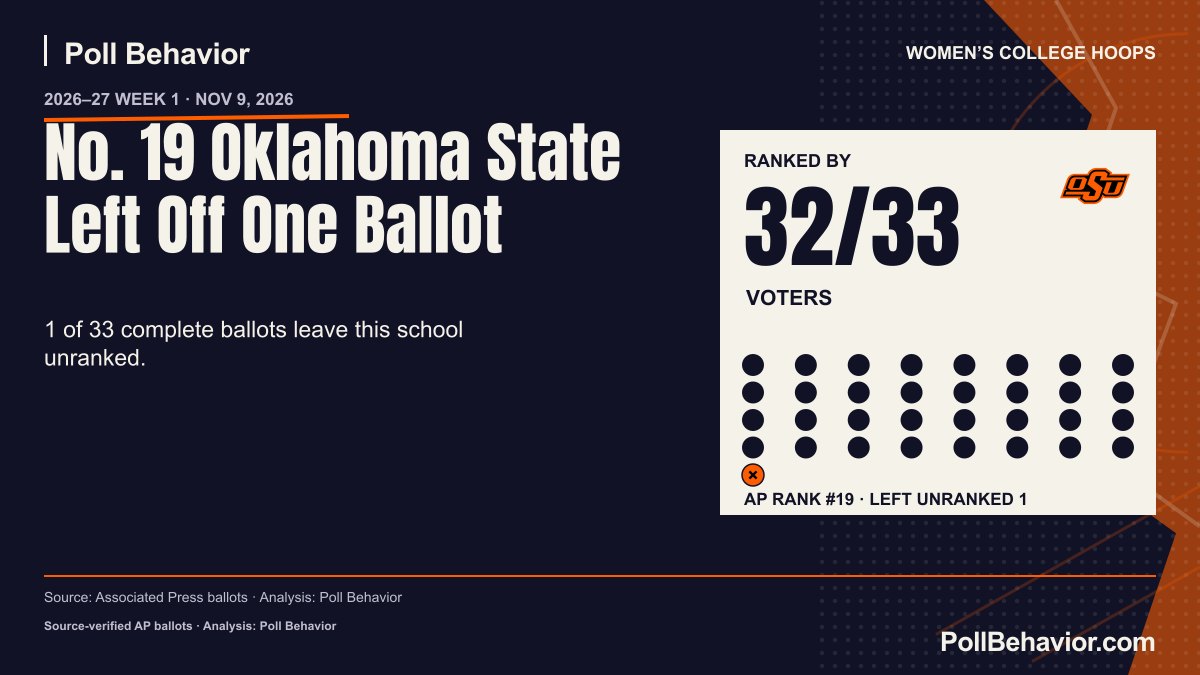
32 of 33 voters ranked Oklahoma State. Cassandra Negley was the only voter to leave the team out.
Download This Graphic
No. 19 Oklahoma State Left Off One Ballot
Top 10 omissions, plus AP-ranked teams included by at least 95% of voters and left out by one to three. Highest AP rank first. Onlycomplete ballots count.
Preseason to Week 1 · AP positions and voter support.
| Team | Previous AP | Current AP | Previously Ranked By | Currently Ranked By | Support Change |
|---|---|---|---|---|---|
| NR | NR | 2/31 | 0/33 | -6.5 pp | |
| NR | NR | 16/31 | 9/33 | -24.3 pp | |
| NR | NR | 6/31 | 10/33 | +10.9 pp | |
| NR | NR | 1/31 | 0/33 | -3.2 pp | |
| NR | NR | 1/31 | 1/33 | -0.2 pp | |
| #4 | #5 | 31/31 | 33/33 | 0.0 pp | |
| NR | NR | 1/31 | 1/33 | -0.2 pp | |
| NR | NR | 0/31 | 1/33 | +3.0 pp | |
| NR | NR | 1/31 | 0/33 | -3.2 pp | |
| #23 | #22 | 22/31 | 29/33 | +16.9 pp | |
| #10 | #10 | 30/31 | 33/33 | +3.2 pp | |
| NR | NR | 5/31 | 4/33 | -4.0 pp | |
| #14 | #12 | 30/31 | 33/33 | +3.2 pp | |
| #7 | #7 | 31/31 | 33/33 | 0.0 pp | |
| #9 | #9 | 31/31 | 33/33 | 0.0 pp | |
| #20 | #19 | 30/31 | 29/33 | -8.9 pp | |
| #5 | #2 | 31/31 | 33/33 | 0.0 pp | |
| NR | NR | 4/31 | 1/33 | -9.9 pp | |
| #17 | #18 | 30/31 | 32/33 | +0.2 pp | |
| #25 | NR | 11/31 | 14/33 | +6.9 pp | |
| NR | #25 | 11/31 | 13/33 | +3.9 pp | |
| #12 | #23 | 30/31 | 22/33 | -30.1 pp | |
| #13 | #13 | 31/31 | 33/33 | 0.0 pp | |
| #18 | #17 | 30/31 | 33/33 | +3.2 pp | |
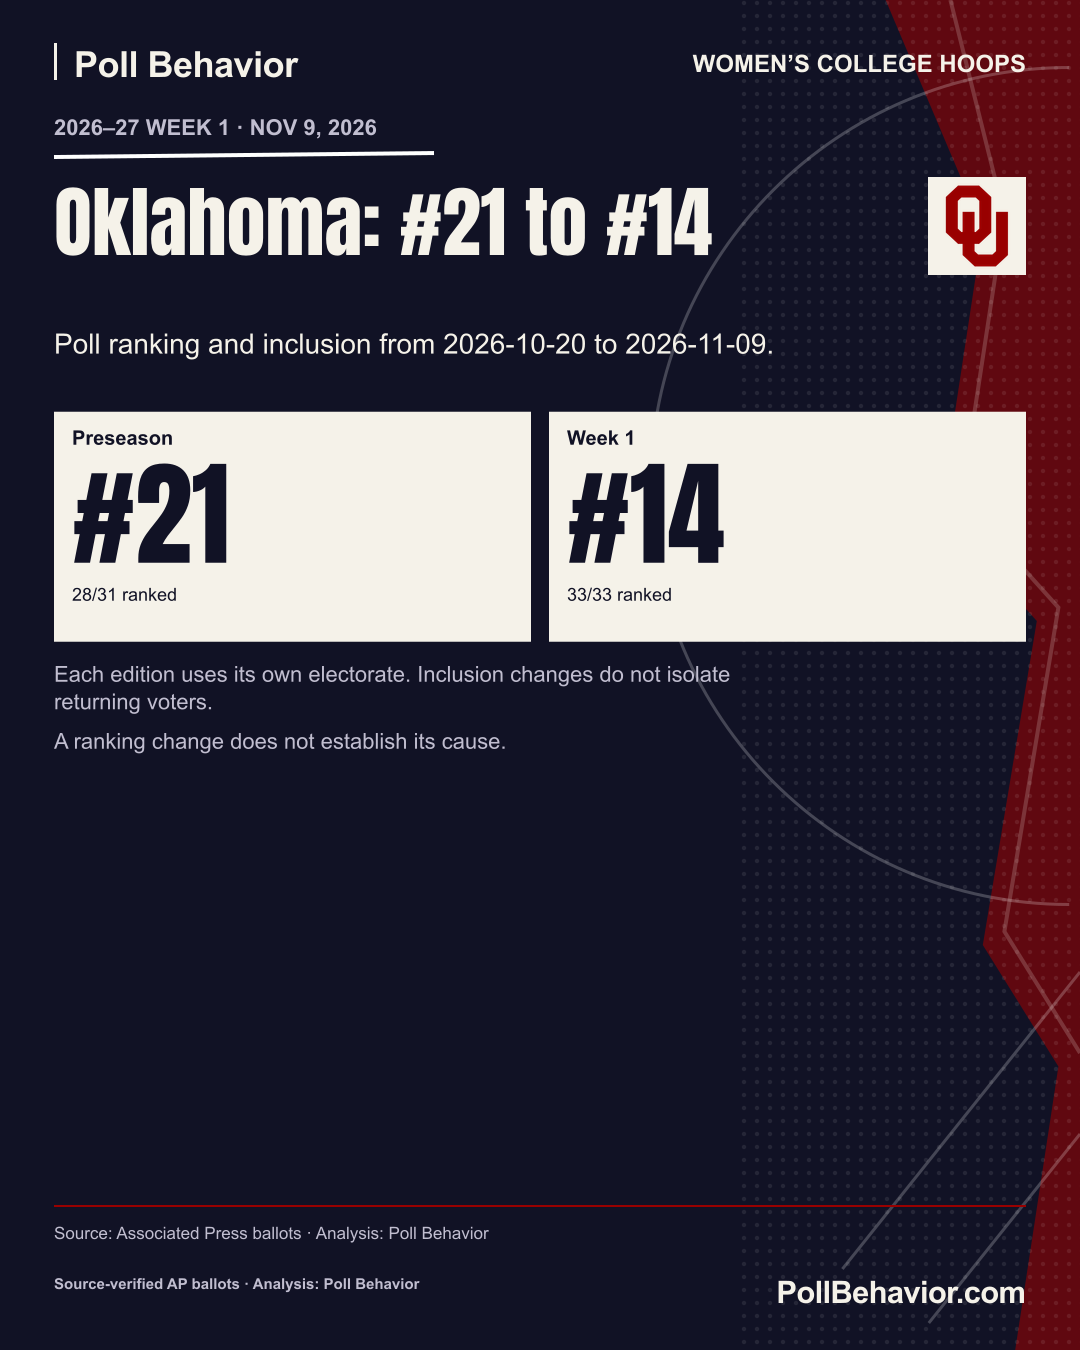
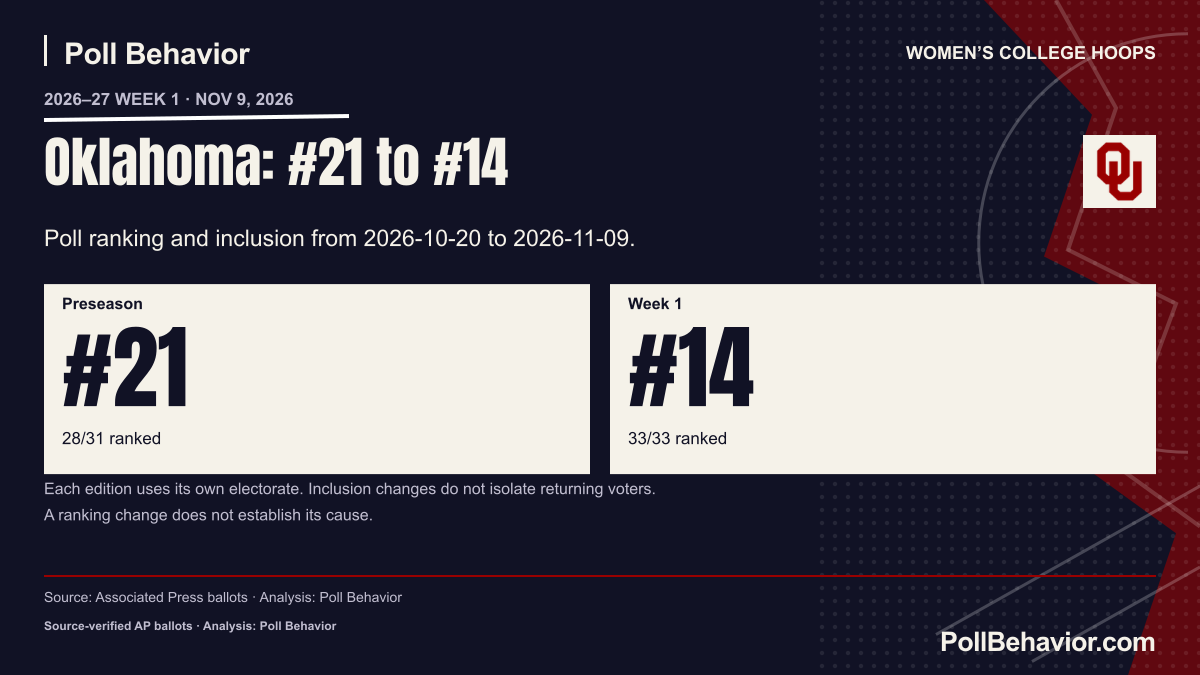
| #21 | #14 | 28/31 | 33/33 | +9.7 pp | |
| #22 | #19 | 28/31 | 32/33 | +6.6 pp | |
| #19 | #21 | 26/31 | 31/33 | +10.1 pp | |
| NR | NR | 1/31 | 0/33 | -3.2 pp | |
| NR | NR | 0/31 | 1/33 | +3.0 pp | |
| NR | NR | 2/31 | 0/33 | -6.5 pp | |
| #1 | #1 | 31/31 | 33/33 | 0.0 pp | |
| NR | NR | 1/31 | 0/33 | -3.2 pp | |
| #15 | #15 | 30/31 | 33/33 | +3.2 pp | |
| NR | NR | 1/31 | 1/33 | -0.2 pp | |
| #6 | #6 | 31/31 | 33/33 | 0.0 pp | |
| #11 | #10 | 30/31 | 33/33 | +3.2 pp | |
| #2 | #4 | 31/31 | 33/33 | 0.0 pp | |
| #3 | #3 | 31/31 | 33/33 | 0.0 pp | |
| #8 | #8 | 31/31 | 33/33 | 0.0 pp | |
| NR | NR | 2/31 | 0/33 | -6.5 pp | |
| NR | NR | 6/31 | 7/33 | +1.9 pp | |
| NR | NR | 1/31 | 0/33 | -3.2 pp | |
| #16 | #16 | 27/31 | 32/33 | +9.9 pp | |
| #24 | #24 | 21/31 | 27/33 | +14.1 pp |
Numeric moves compare teams ranked in both polls. NR has no numbered position. Support changes use each week’s own voters; pp means percentage points.
Download This Graphic
Compare the AP result, numbered votes, and ballots that left each team out.
Select a Team to Explore Its Votes
| Rank | Team | Conference | AP Rank | Ranked | Unranked | Highest–Lowest | |
|---|---|---|---|---|---|---|---|
| 1 | Atlantic Coast Conference | #23 | 22 / 33 | 11 / 33 | #14–#25 | 3.73 | |
| 2 | Southeastern Conference | #14 | 33 / 33 | 0 / 33 | #9–#23 | 3.57 | |
| 3 | Big Ten Conference | #16 | 32 / 33 | 1 / 33 | #10–#25 | 3.46 | |
| 4 | Big 12 Conference | #19 | 32 / 33 | 1 / 33 | #6–#24 | 3.46 | |
| 5 | Atlantic Coast Conference | #13 | 33 / 33 | 0 / 33 | #8–#25 | 3.32 |
| Position | Votes |
|---|---|
| #1 | 0 |
| #2 | 0 |
| #3 | 0 |
| #4 | 0 |
| #5 | 0 |
| #6 | 0 |
| #7 | 0 |
| #8 | 0 |
| #9 | 0 |
| #10 | 0 |
| #11 | 0 |
| #12 | 0 |
| #13 | 0 |
| #14 | 2 |
| #15 | 0 |
| #16 | 3 |
| #17 | 1 |
| #18 | 0 |
| #19 | 0 |
| #20 | 2 |
| #21 | 2 |
| #22 | 2 |
| #23 | 1 |
| #24 | 5 |
| #25 | 4 |
| Unranked (NR) | 11 |
22 of 33 voters ranked North Carolina; 11 left the team unranked.
Average numbered vote: #21.00.
: 3.73. This poll’s median is 2.60 among teams with at least 10 ranked votes.
Previously AP #12, ranked by 30/31 voters.
Explore Advanced Analytics →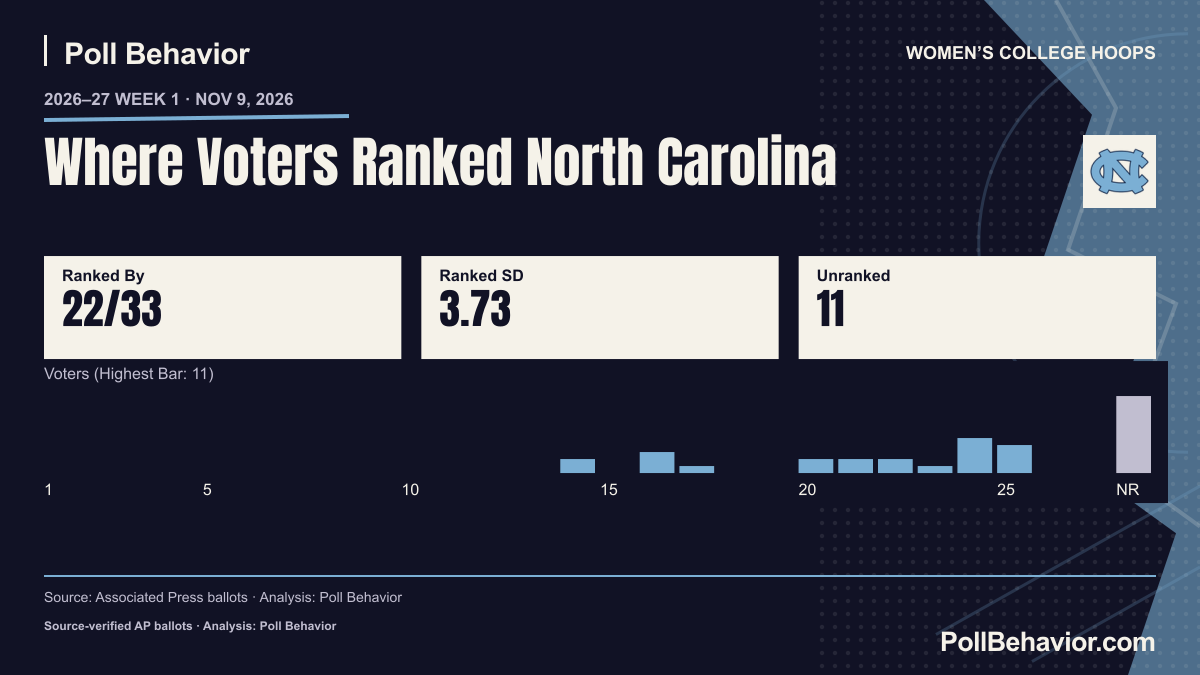
Download This Graphic
Where Voters Ranked North Carolina
At least 10 ranked votes required. Top five plus ties. A team can qualify with an AP result of NR.
The largest gaps between one voter’s numbered ranking and the final AP poll.
| Rank | Voter | Team | Voter’s Rank | AP Rank | Difference |
|---|---|---|---|---|---|
| 1 | Murray Evans → | #6 | #19 | 13 Spots Higher | |
| 1 | Murray Evans → | #23 | #10 | 13 Spots Lower | |
| 3 | Reed Darcey → | #25 | #13 | 12 Spots Lower | |
| 4 | Percy Allen → | #21 | #10 | 11 Spots Lower | |
| 4 | Sabreena Merchant → | #14 | #25 | 11 Spots Higher |
Biggest individual gap first. Both voter and AP must rank the team. All cutoff ties are included. Whole-ballot averages are separate below.
Compare Voters Side by Side →Which teams come closest to half the voters ranking them and half leaving them out?
Smallest Ranked–Unranked Gap First · Equal Gaps Share a Rank
| Rank | Team | AP Rank | Ranked | Unranked | Voter Gap |
|---|---|---|---|---|---|
| 1 | NR | 14 / 33 | 19 / 33 | 5 | |
| 2 | #25 | 13 / 33 | 20 / 33 | 7 | |
| 3 | #23 | 22 / 33 | 11 / 33 | 11 | |
| 4 | NR | 10 / 33 | 23 / 33 | 13 | |
| 5 | NR | 9 / 33 | 24 / 33 | 15 |
How often voters include or omit teams compared with the AP Top 25.
Largest count first, including ties at fifth. All 33 complete ballots count. NR is not a numbered rank.
Whole-ballot comparisons, sample sizes, and the numbers behind the highlights.
Ordered by average absolute gap (), using every team ranked by both the voter and AP. A single unusual vote does not necessarily produce the most unusual whole ballot.
| Rank | Voter | Teams Compared | Added | Omitted | |
|---|---|---|---|---|---|
| 1 | Jeff Linder → | 4.32 | 22 | 3 | 3 |
| 2 | Olivia Eisenhauer → | 4.27 | 22 | 3 | 3 |
| 3 | Murray Evans → | 3.41 | 22 | 3 | 3 |
| 4 | Brenda VanLengen → | 2.86 | 22 | 3 | 3 |
| 5 | Sabreena Merchant → | 2.74 | 23 | 2 | 2 |