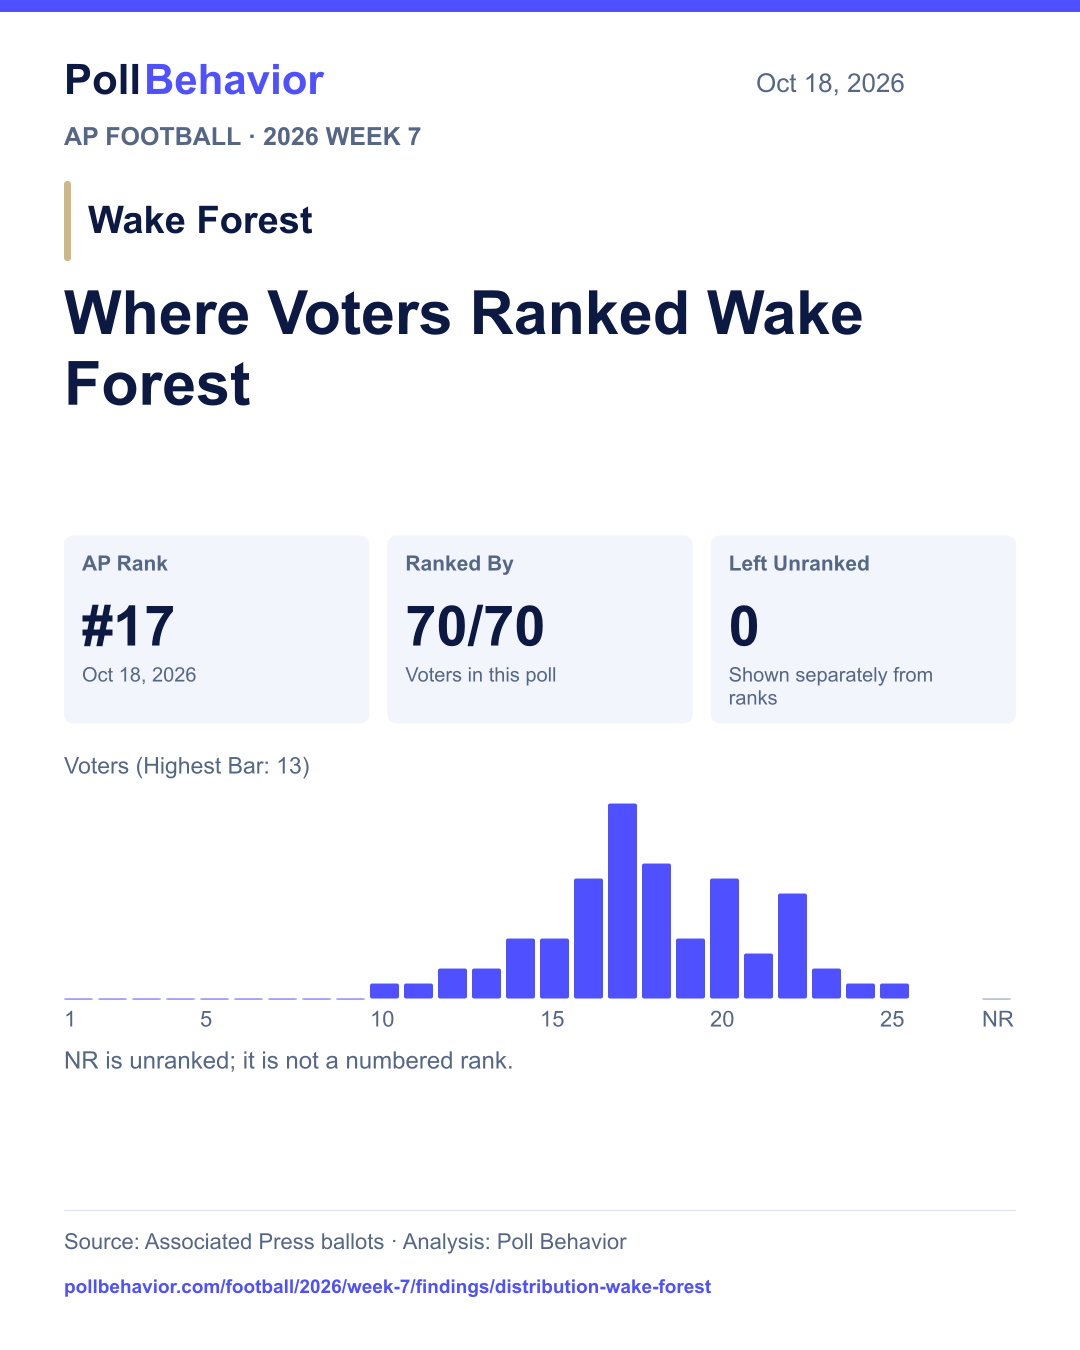
Biggest Disagreement


#10–#25
3.13 SD · 0 Unranked Votes
Explore the Votes →The votes, teams, and results that stand out this week.
2026 Week 7 · A quick look at this week’s standout votes and moves.
3.13 SD · 0 Unranked Votes
Explore the Votes →AP Rank · Previous → Current
See Poll Changes →Voters Ranking or Leaving Out
See the Split →Highly ranked teams left off ballots, and teams nearly everyone included.
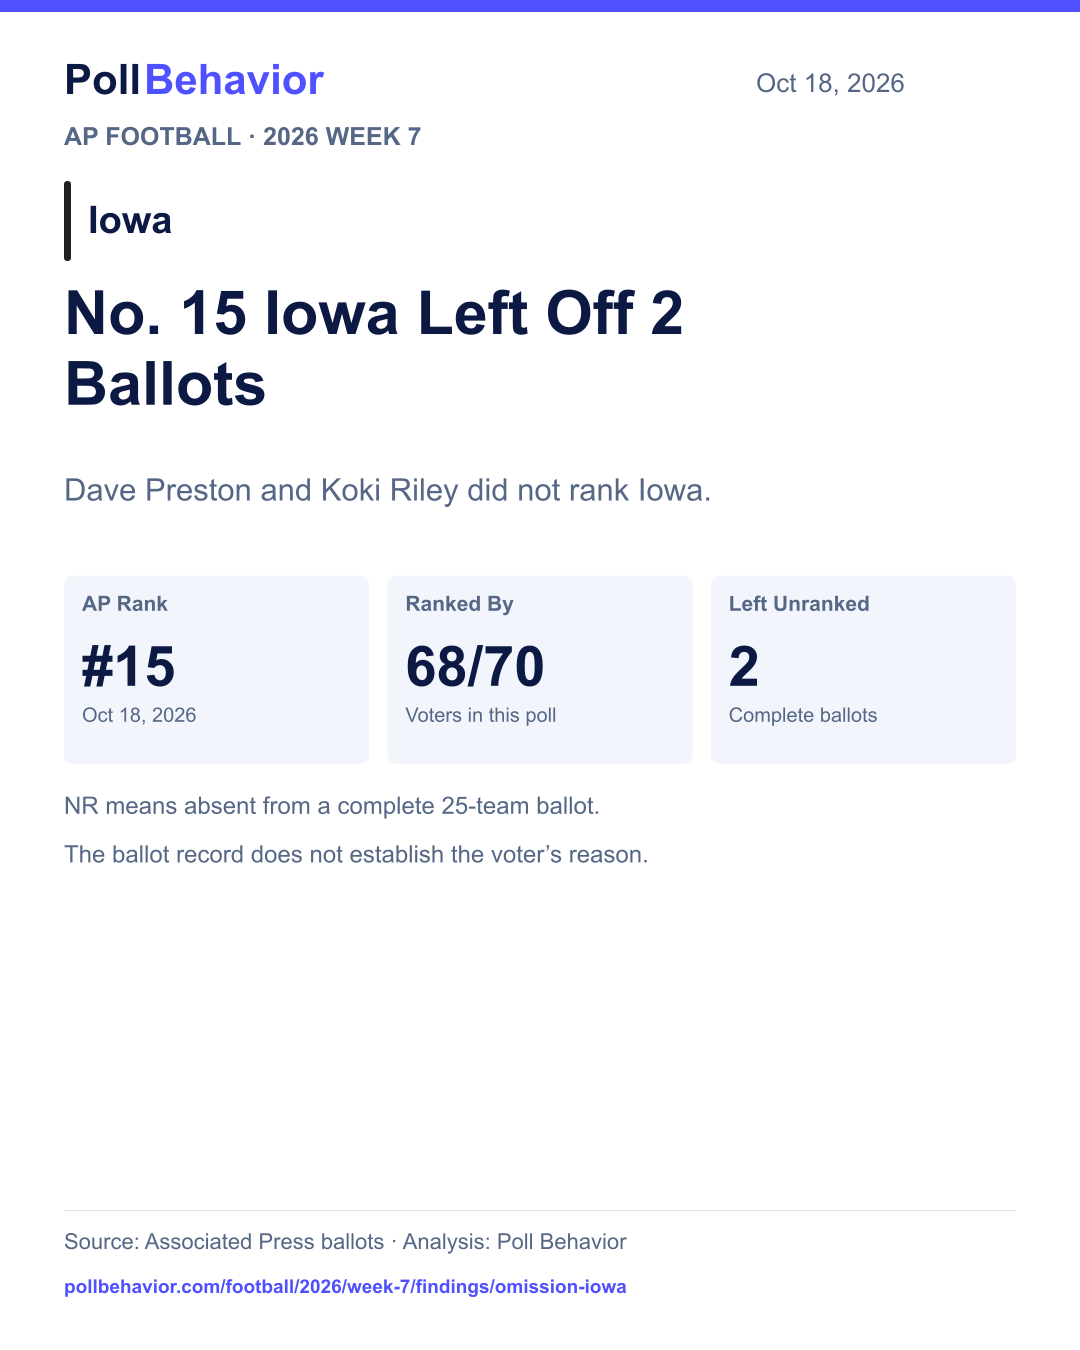
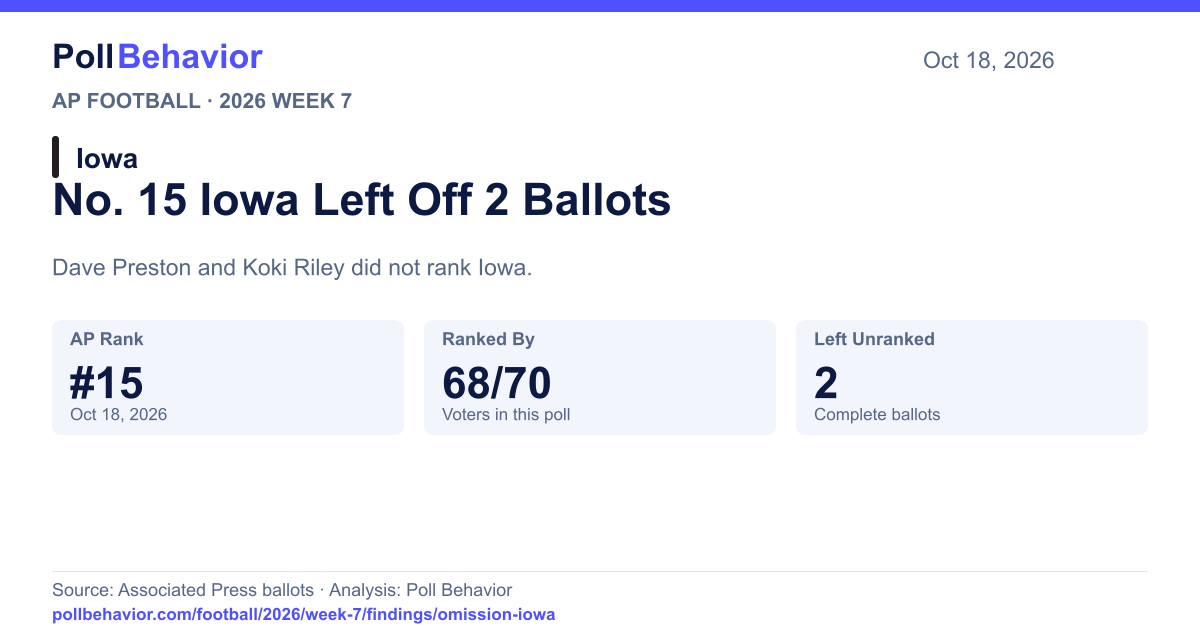
68 of 70 voters ranked Iowa. 2 voters left the team out.
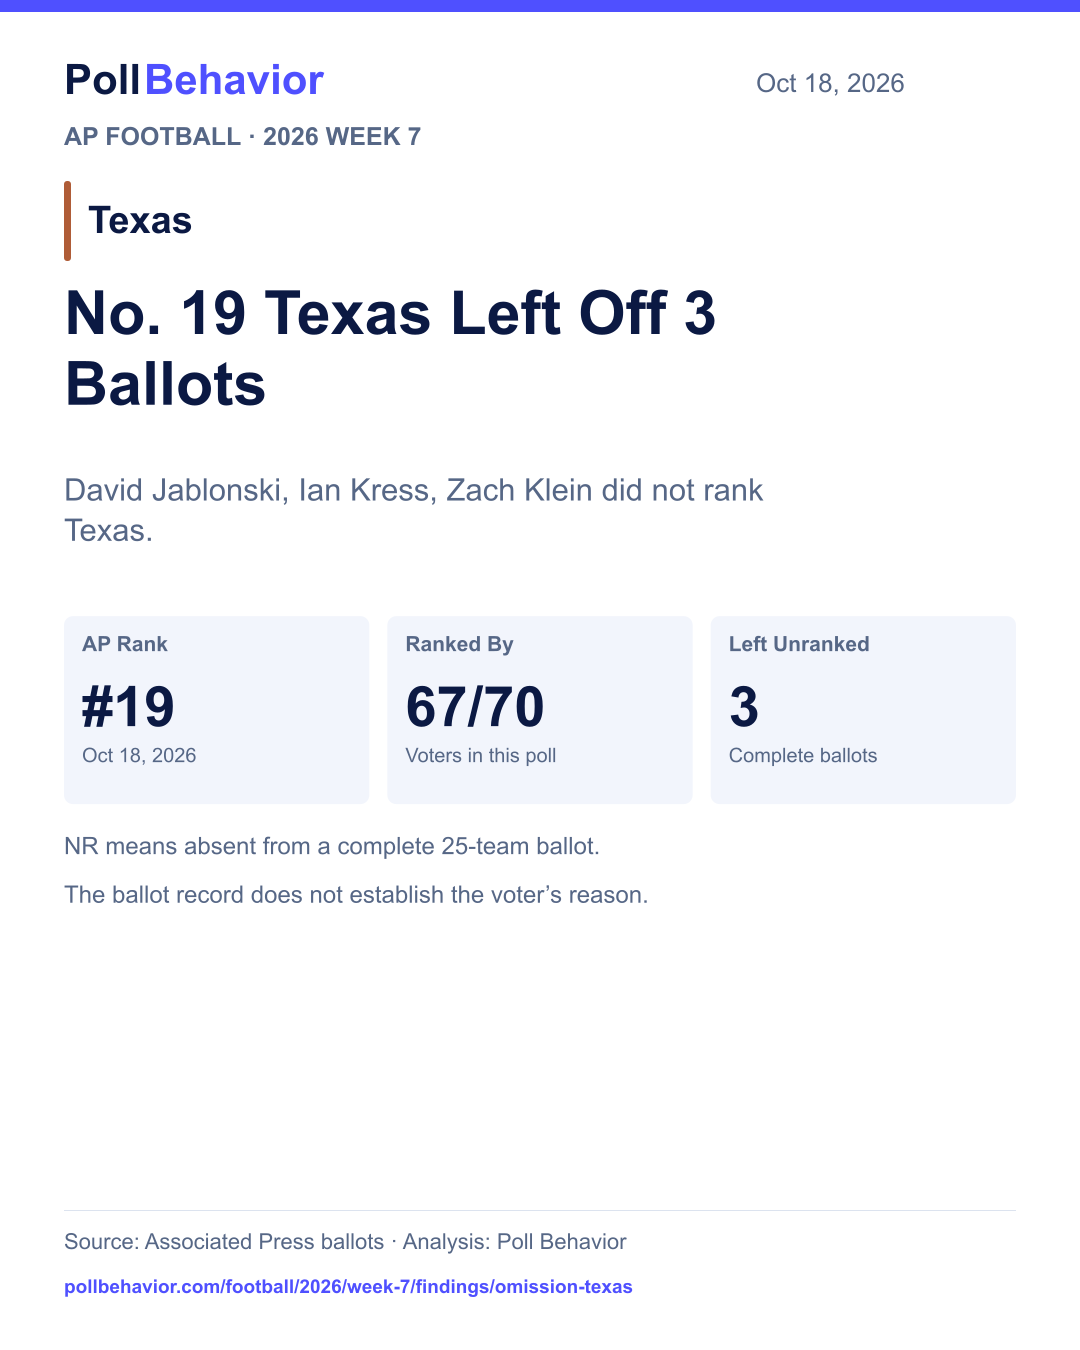
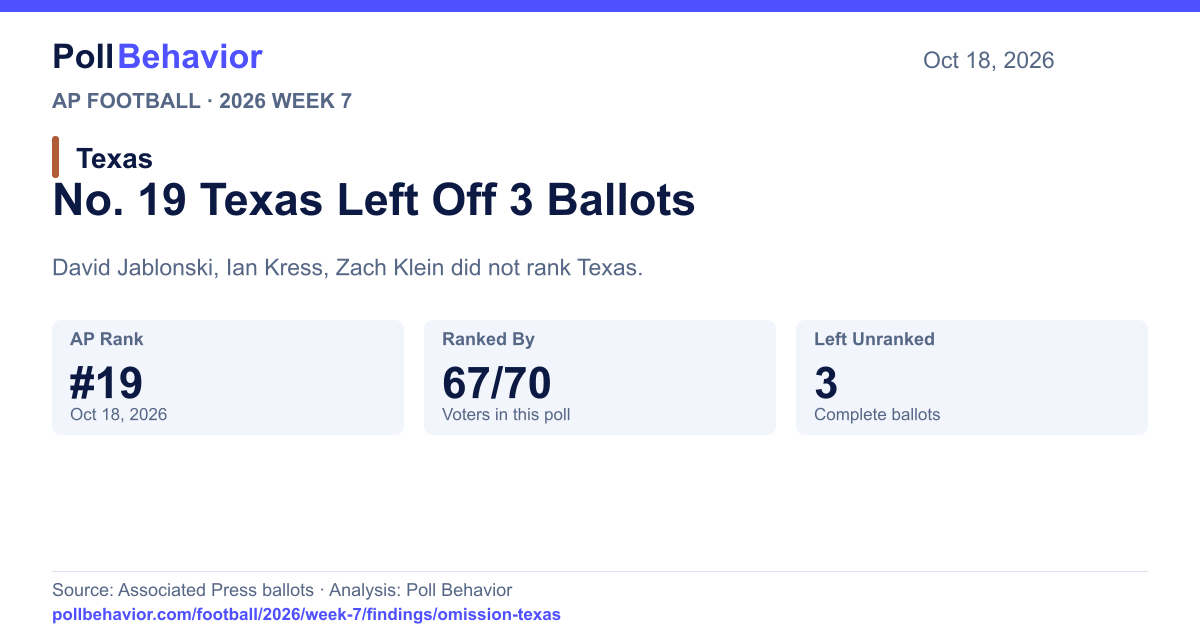
67 of 70 voters ranked Texas. 3 voters left the team out.
Top 10 omissions, plus AP-ranked teams included by at least 95% of voters and left out by one to three. Highest AP rank first. Onlycomplete ballots count.
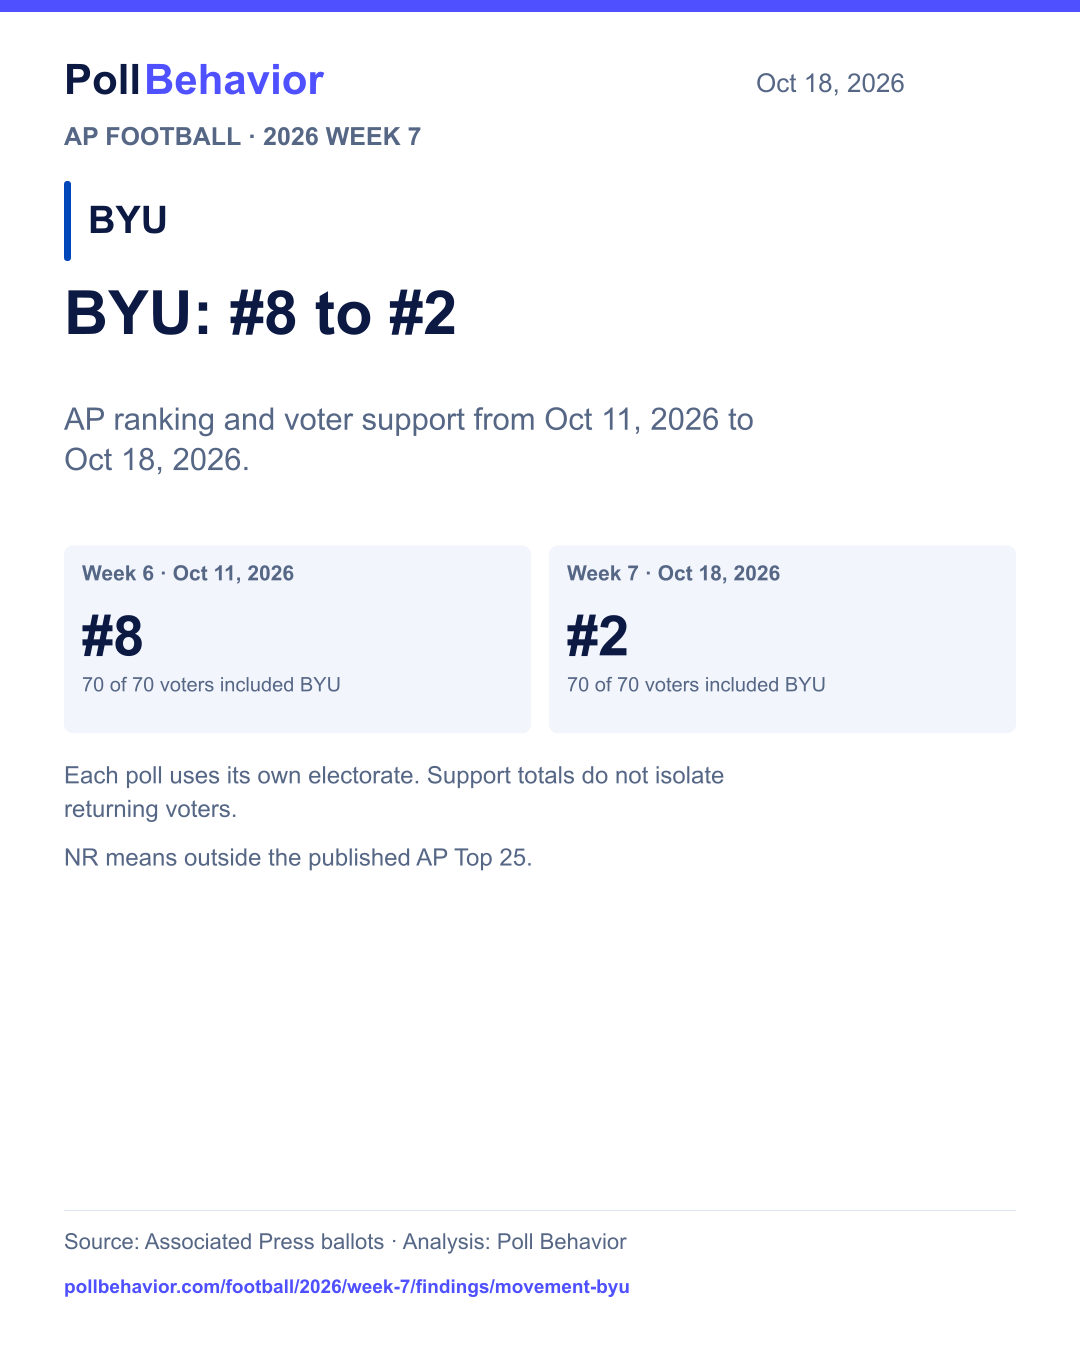
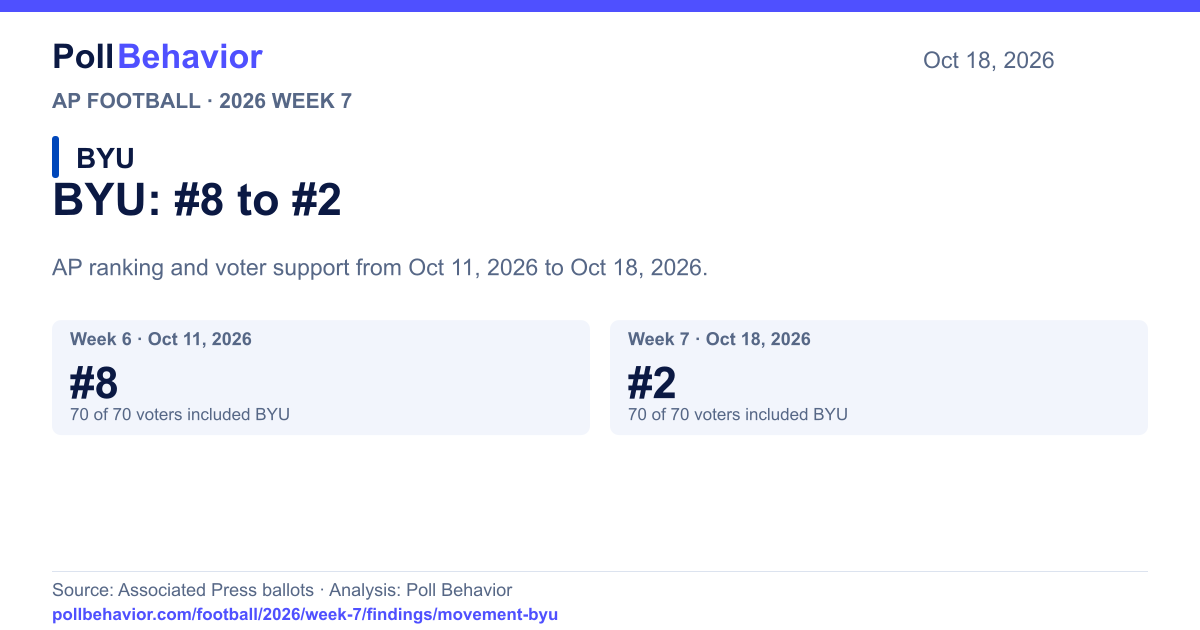
Week 6 to Week 7 · AP positions and voter support.
| Team | Previous AP | Current AP | Previously Ranked By | Currently Ranked By | Support Change |
|---|---|---|---|---|---|
| #6 | #13 | 70/70 | 70/70 | 0.0 pp | |
| NR | #25 | 24/70 | 33/70 | +12.9 pp | |
| NR | NR | 0/70 | 21/70 | +30.0 pp | |
| #23 | #21 | 57/70 | 60/70 | +4.3 pp | |
| #8 | #2 | 70/70 | 70/70 | 0.0 pp | |
| NR | NR | 1/70 | 0/70 | -1.4 pp | |
| NR | #20 | 4/70 | 61/70 | +81.4 pp | |
| #1 | #5 | 70/70 | 70/70 | 0.0 pp | |
| #20 | #14 | 66/70 | 70/70 | +5.7 pp | |
| #5 | #6 | 70/70 | 70/70 | 0.0 pp | |
| #17 | #15 | 70/70 | 68/70 | -2.9 pp | |
| NR | NR | 15/70 | 21/70 | +8.6 pp | |
| #15 | #12 | 68/70 | 70/70 | +2.9 pp | |
| #22 | #18 | 56/70 | 65/70 | +12.9 pp | |
| #3 | #1 | 70/70 | 70/70 | 0.0 pp | |
| #16 | NR | 67/70 | 6/70 | -87.1 pp | |
| #13 | #22 | 70/70 | 52/70 | -25.7 pp | |
| NR | NR | 15/70 | 0/70 | -21.4 pp | |
| NR | NR | 2/70 | 5/70 | +4.3 pp | |
| #25 | #24 | 30/70 | 64/70 | +48.6 pp | |
| #2 | #4 | 70/70 | 70/70 | 0.0 pp | |
| #4 | #3 | 70/70 | 70/70 | 0.0 pp | |
| NR | NR | 16/70 | 0/70 | -22.9 pp | |
| #18 | NR | 69/70 | 28/70 | -58.6 pp | |
| #9 | #7 | 70/70 | 70/70 | 0.0 pp | |
| NR | NR | 22/70 | 25/70 | +4.3 pp | |
| NR | NR | 1/70 | 3/70 | +2.9 pp | |
| #24 | #23 | 39/70 | 57/70 | +25.7 pp | |
| #14 | #11 | 67/70 | 70/70 | +4.3 pp | |
| #7 | #19 | 70/70 | 67/70 | -4.3 pp | |
| #10 | #8 | 70/70 | 70/70 | 0.0 pp | |
| #12 | #9 | 70/70 | 70/70 | 0.0 pp | |
| #19 | #16 | 64/70 | 64/70 | 0.0 pp | |
| #11 | #10 | 70/70 | 70/70 | 0.0 pp | |
| #21 | #17 | 68/70 | 70/70 | +2.9 pp | |
| NR | NR | 19/70 | 0/70 | -27.1 pp |
Numeric moves compare teams ranked in both polls. NR has no numbered position. Support changes use each week’s own voters; pp means percentage points.
Download This Graphic
Compare the AP result, numbered votes, and ballots that left each team out.
Select a Team to Explore Its Votes
| Rank | Team | Conference | AP Rank | Ranked | Unranked | Highest–Lowest | |
|---|---|---|---|---|---|---|---|
| 1 | ACC | #17 | 70 / 70 | 0 / 70 | #10–#25 | 3.13 | |
| 2 | Big 12 | #25 | 33 / 70 | 37 / 70 | #12–#25 | 3.13 | |
| 3 | SEC | #19 | 67 / 70 | 3 / 70 | #12–#25 | 2.99 | |
| 4 | SEC | #20 | 61 / 70 | 9 / 70 | #14–#25 | 2.90 | |
| 5 | Big Ten | #16 | 64 / 70 | 6 / 70 | #12–#25 | 2.82 |
| Position | Votes |
|---|---|
| #1 | 0 |
| #2 | 0 |
| #3 | 0 |
| #4 | 0 |
| #5 | 0 |
| #6 | 0 |
| #7 | 0 |
| #8 | 0 |
| #9 | 0 |
| #10 | 1 |
| #11 | 1 |
| #12 | 2 |
| #13 | 2 |
| #14 | 4 |
| #15 | 4 |
| #16 | 8 |
| #17 | 13 |
| #18 | 9 |
| #19 | 4 |
| #20 | 8 |
| #21 | 3 |
| #22 | 7 |
| #23 | 2 |
| #24 | 1 |
| #25 | 1 |
| Unranked (NR) | 0 |
70 of 70 voters ranked Wake Forest; 0 left the team unranked.
Average numbered vote: #17.80.
: 3.13. This poll’s median is 2.24 among teams with at least 10 ranked votes.
Previously AP #21, ranked by 68/70 voters.
Explore Advanced Analytics →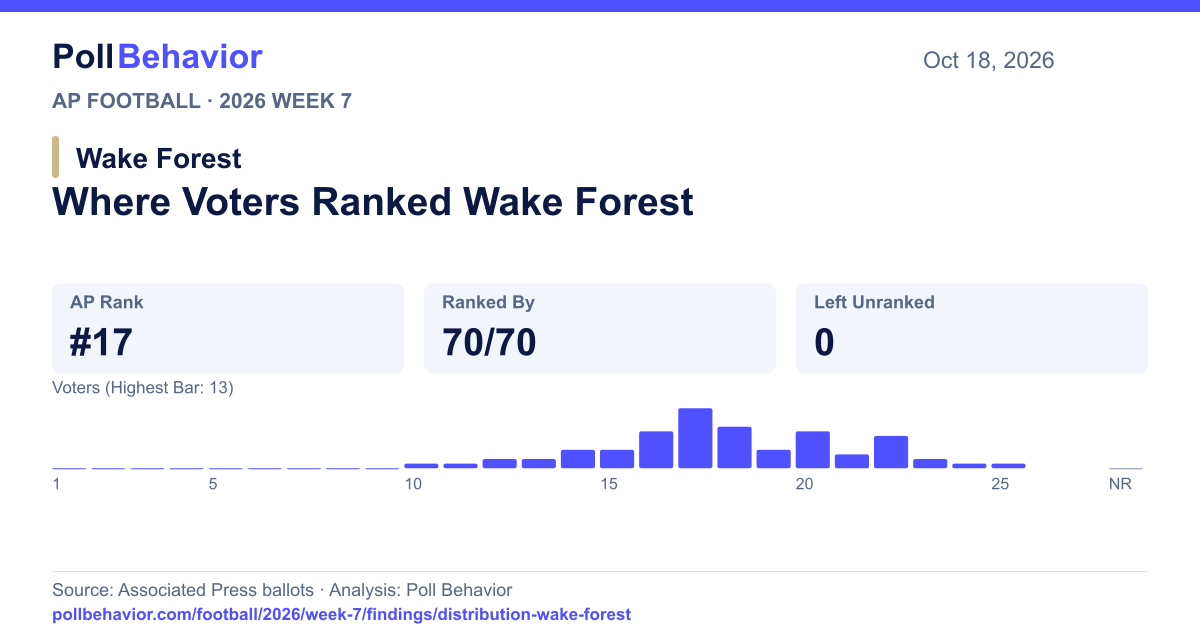
At least 10 ranked votes required. Top five plus ties. A team can qualify with an AP result of NR.
The largest gaps between one voter’s numbered ranking and the final AP poll.
| Rank | Voter | Team | Voter’s Rank | AP Rank | Difference |
|---|---|---|---|---|---|
| 1 | Koki Riley → | #12 | #25 | 13 Spots Higher | |
| 2 | Brian Fonseca → | #15 | #25 | 10 Spots Higher | |
| 3 | Dylan Sinn → | #16 | #25 | 9 Spots Higher | |
| 3 | Ralph Russo → | #25 | #16 | 9 Spots Lower | |
| 3 | Stephen Means → | #15 | #24 | 9 Spots Higher | |
| 3 | Murray Evans → | #25 | #16 | 9 Spots Lower |
Biggest individual gap first. Both voter and AP must rank the team. All cutoff ties are included. Whole-ballot averages are separate below.
Compare Voters Side by Side →Which teams come closest to half the voters ranking them and half leaving them out?
Smallest Ranked–Unranked Gap First · Equal Gaps Share a Rank
| Rank | Team | AP Rank | Ranked | Unranked | Voter Gap |
|---|---|---|---|---|---|
| 1 | #25 | 33 / 70 | 37 / 70 | 4 | |
| 2 | NR | 28 / 70 | 42 / 70 | 14 | |
| 3 | NR | 25 / 70 | 45 / 70 | 20 | |
| 4 | NR | 21 / 70 | 49 / 70 | 28 | |
| 4 | NR | 21 / 70 | 49 / 70 | 28 |
How often voters include or omit teams compared with the AP Top 25.
Largest count first, including ties at fifth. All 70 complete ballots count. NR is not a numbered rank.
Final game results alongside the AP poll before kickoff and the following poll.
Final scores alongside the next AP poll. Top 25 entries and exits come first, followed by the biggest numbered rank changes. Ballot counts show how voter support changed between those polls.
Ballots Ranking Oklahoma State: 69/70 → 28/70
Ballots Ranking Notre Dame: 70/70 → 70/70
Results provide context. They do not establish why a voter changed a ballot, and rankings are not game predictions.
Whole-ballot comparisons, sample sizes, and the numbers behind the highlights.
Ordered by average absolute gap (), using every team ranked by both the voter and AP. A single unusual vote does not necessarily produce the most unusual whole ballot.
| Rank | Voter | Teams Compared | Added | Omitted | |
|---|---|---|---|---|---|
| 1 | Stephen Means → | 3.70 | 23 | 2 | 2 |
| 2 | Chris Murray → | 3.04 | 23 | 2 | 2 |
| 3 | Brian Fonseca → | 2.96 | 24 | 1 | 1 |
| 4 | Dylan Sinn → | 2.95 | 22 | 3 | 3 |
| 5 | Koki Riley → | 2.90 | 21 | 4 | 4 |